

June 14, 2011 update: As has been all too apparent since late 2008, the total number of travel nurses varies from month to month. This original article (below this update) from 2007 is wildly inaccurate as a measure of total travel nurses today, 6 months ago, or a year ago. Basic research done for the History of Travel Nursing article (also published today) has enabled us to create a continuous graph representing total nurse travelers from the beginning of the industry in 1978 to the present day. We plan on updating this graph every two years or so with up-to-date numbers.
Sources include the original research cited below from 2007, interviews with agency owners and recruiters both current, and the original pioneers, and numbers from annual/quarterly reports of publicly held large agencies (listed on the stock exchanges). The text below and graph is copied from the broader article on the History of Travel Nursing . In addition to the below graph and text, interested readers of this article may also be interested in the graph of "Who's the biggest agency? ", which shows which agency is the largest, also dating back to 1978.
Booms and busts
In theory, there has been an expanding nursing shortage nationwide since the 1970's. This has led not only to rising pay, but also the development of contingent (temporary) staffing models such as travel nurse companies and the increased utilization of per diem staffing. Despite this ongoing shortage, nurses are not exempt from downturns in the economy and there have been three major downturns for travelers since 1978.
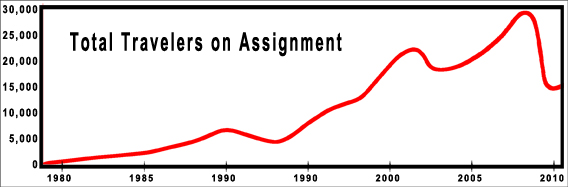
The first downturn was 1991 to 1994. Travelers on assignment dropped by 35 percent. While there was a mild nationwide recession during these years, the rise of managed care created a double whammy for travelers. There was a major shift in emphasis from inpatient care to outpatient care. At the time, between 60 and 70 percent of travelers were med-surg where the shift to managed care had the greatest impact in the hospital.
Because of this shift to managed care, acuity of hospitalized patients rose rapidly in the 1990's. The numbers of med-surg nurses began to fall and specialties such as telemetry, ICU, and ER nursing started to increase. The same demands for specialties shifted the demand for travel nurses with the requisite experience. Nurses also had to be more productive, with increasing numbers of patients per nurse. These factors, while not reducing the nurse shortage, effectively reduced the rate the shortage was increasing, and led to the real downturn of the early 1990’s.
Between late 2002 and 2004, another economic downturn caused the number of travelers to again drop 35 percent. In terms of total numbers of travelers, this was a much larger drop than the first downturn as the industry had grown dramatically since 1995, a loss of about 6,000 travelers from about 23,000 total travelers.
Mid 2008 saw the numbers of nurse travelers peak at close to 30,000 full time equivalents (the bottom industry estimate is 26,000). In late 2008, travel assignments stopped rising, and there was a dramatic and precipitous drop of nearly half of the travelers on assignment by spring 2009 (some sources estimate an average 55% drop, and a few individual agencies saw a short trough of 70% of the peak). While the economic downturn is still lingering, in late 2010 travel assignments increased by 10 percent over the same period in late 2009, possibly signaling the end of the general employment downturn. However, the total number of travelers on assignment in early 2011 is still only a bit more than half the number in 2008.
Currently in mid-2011, there is an increasing demand to supply ratio, with many travel positions unfilled. As the economy continues to improve, so will the nationwide census, increasing demand for healthcare workers. Eventually, worker confidence will improve, and more will leave their staff jobs to become travelers again.
It might seem counterintuitive that work orders for travel nurses would drop in the middle of a general downturn, after all, everyone still needs healthcare. However, there are some good reasons why assignments do fall. A major fundamental at work here is that historically a large number of trained nurses are not currently working as nurses. In 2008 the total national supply of registered nurses was 3 million and working nurses numbered only 2.6 million. That left 400,000 nurses able to shift into nursing jobs and able to quickly fill open positions.
In any economic downturn, one of the driving forces is fear. Fear of losing family income (for example a spouse threatened with a layoff) will entice nurses out of retirement or from low paying or low security non-nursing jobs. These same forces mean many travelers will leave for the security of staff positions, which of course means fewer open positions for a traveler.
Fear of losing jobs also means that many employed Americans with insurance will defer care such as elective surgery. Many of the unemployed have lost their insurance or cannot afford needed healthcare. This reduces the demand for all healthcare workers.
Fear by hospital administrators results in belt tightening, and making do with fewer employees than is optimal. And it was not only fear of the unknown in this recent downturn. It turns out that the average large hospital makes a considerable amount from their investment portfolios, often exceeding their profit from hospital operations. Just as personal retirement accounts dropped with the fall in the markets, so did hospital investment income drop, sometimes over half. This meant far less of a cushion, and often a negative cash flow position, driving managers to slash costs, and hospital's highest costs are nurses as a percentage of a hospital’s total budget.
All these factors combine to bring down the need for temp workers in an economic downturn, even though the nursing shortage is a continued reality. One point of interest is that temporary work is called a "leading economic indicator", which means that rises and falls in temp workers such as travelers precedes the general economy. Thus traveler jobs are the first to go in a downturn, and the first to come back.
-
As an aside, while nurses suffer in downturns, general hospital staffing such as clerical, followed by accounting/finance workers, and information technology, typically experienced downturns before nurses as they are not considered “essential” workers like nurses. However became obvious, even nurses were not immune, and because they make up the largest population of employees in any hospital, layoffs have a larger impact.
When traveler jobs drop, so do agency recruiter jobs. Their numbers have dropped precipitously in the general downturn that started in 2008, and similarly in other downturns. The average recruiter workload per traveler has increased as hospitals have gotten substantially pickier about candidates with a 40 year high in nurse unemployment. Often recruiters have to submit travelers to dozens of potential assignments to land one.
Total number of active nurse travelers revealed!
May 28, 2007: PanTravelers estimates there are currently over 25,500 Registered Nurse Travelers in the U.S. Other anecdotal industry estimates place the number at closer to 20,000. Statistics on the LVN/LPN Allied Health Traveler population are less abundant.
Association estimates are based upon a synthesis of findings from the 2004 National Sample Survey of Registered Nurses, the U.S. Dept of Health and Human Services - Health Resources and Services Administration, and from the U.S. Current Population Survey (CPS - A joint effort between the Bureau of Labor Statistics and the Census Bureau).

Methodology Summary: As of March 2004, the U.S. Dept of Health and Human Services - Health Resources and Services Administration, and the U.S. Current Population Survey estimated 2.9 million individuals had current licenses to practice as Registered Nurses in the United States. Of 30,233 Registered Nurses sampled, 268 identified themselves as Traveling Nurses. This is equivalent to 0.88% of the total Registered Nurse population. A weighting procedure was used to account for duplication of licenses from State to State so that estimates could be developed of the number of individuals who hold active licenses to practice as RNs, regardless of the number of State licenses they hold. http://bhpr.hrsa.gov/healthworkforce/rnsurvey04/appendixa.htm
The target population for the eighth NSSRN included all registered nurses with an active license in the United States as of March 2004. A sampling frame was required to select a probability sample of nurses from which valid inferences could be made to the target population. The sampling frame for the eighth NSSRN consisted of all registered nurses who are currently eligible to practice as an RN in the U.S. This sampling frame included RNs who have received a specialty license or have been certified by a State agency as an advanced practiced nurse (APNs) such as nurse practitioner, certified nurse midwives, certified registered nurse anesthetist, or clinical nursing specialist and excluded licensed practical nurses (LPNs)/licensed vocational nurses (LVNs).
State Boards of Nursing in the 50 States and in the District of Columbia (hereafter also referred to as a State) provided files containing the name, address, and license number of every RN currently holding an active license in that State. These files formed the basis of the sampling frame from which the RNs for each State were selected.
This design approach takes into account two key characteristics of the sampling frame. First, no single list of all individuals with licenses to practice as registered nurses in the United States exists, although lists of those who have licenses in any one State are available. Second, a nurse may be licensed in more than one State. The advantage of the nested alpha-segment design is that one can determine the probabilities of selection and appropriate multiplicity adjusted weights for those nurses that are listed in more than one State. In addition, the design also permits the use of each sample registered nurses’ data for State estimates of each of her/his States of licensure.